
Entertainment is a significant part of the lives of many. From streaming movies and TV shows to enjoying live performances and downloading your favorite podcasts, the way Americans consume content is constantly evolving.
With new forms of media becoming increasingly popular, there will always be new costs for people to consider when balancing their entertainment budget.
The team at RSS.com is always looking to stay at the forefront of these rapidly shifting entertainment trends to understand what consumers want and to better support content creators and their audiences.
To learn more about how people spend on entertainment today, we surveyed people across the U.S., asking them to share their estimated monthly expenses on digital, in-person, and special occasion entertainment.
More specifically, we’ll take a closer look:
- How people are spending.
- Where the bulk of their spending happens.
- How newer forms of entertainment factor into the equation.
Whether it’s supporting content creators or enjoying a night out, discover how Americans are allocating their budgets for fun.
Which U.S. States Spend the Most on Entertainment?

According to our survey, the national average spend on entertainment is $8,258 annually. We asked residents across the U.S. about their monthly spending on digital and in-person entertainment, as well as their annual spending on special occasion entertainment. Here’s what we found:
The states that spend the most on entertainment are:
New Hampshire – $11,336
- Annual Spending on Digital Entertainment: $4,592
- Annual Spending on In-Person Entertainment: $3,054
- Annual Special Occasion Spending: $3,690
Ohio – $11,032
- Annual Spending on Digital Entertainment: $3,717
- Annual Spending on In-Person Entertainment: $3,731
- Annual Special Occasion Spending: $3,584
Nevada – $10,921
- Annual Spending on Digital Entertainment: $3,669
- Annual Spending on In-Person Entertainment: $5,294
- Annual Special Occasion Spending: $1,958
Delaware – $10,035
- Annual Spending on Digital Entertainment: $3,400
- Annual Spending on In-Person Entertainment: $4,440
- Annual Special Occasion Spending: $2,195
Iowa – $9,732
- Annual Spending on Digital Entertainment: $3,046
- Annual Spending on In-Person Entertainment: $3,954
- Annual Special Occasion Spending: $2,732
New Hampshire’s high entertainment spending is driven by the largest reported expenditures on both digital and special occasion entertainment. Nevada stands out for its top spending on in-person entertainment, which aligns with the numerous live entertainment options available in cities like Las Vegas.
The states that spend the least on entertainment are:
Utah – $5,925
- Annual Spending on Digital Entertainment: $2,320
- Annual Spending on In-Person Entertainment: $2,044
- Annual Special Occasion Spending: $1,560
Michigan – $6,066
- Annual Spending on Digital Entertainment: $2,558
- Annual Spending on In-Person Entertainment: $2,287
- Annual Special Occasion Spending: $1,221
Florida – $6,470
- Annual Spending on Digital Entertainment: $2,589
- Annual Spending on In-Person Entertainment: $2,872
- Annual Special Occasion Spending: $1,008
New Mexico – $6,615
- Annual Spending on Digital Entertainment: $2,502
- Annual Spending on In-Person Entertainment: $2,393
- Annual Special Occasion Spending: $1,720
West Virginia – $6,884
- Annual Spending on Digital Entertainment: $3,115
- Annual Spending on In-Person Entertainment: $2,472
- Annual Special Occasion Spending: $1,297
Utah spends the least on both digital and in-person entertainment. Michigan follows closely, ranking in the bottom three for both categories, making it the state with the second lowest entertainment expenditure annually.
Does Your State Spend More on Digital or In-Person Entertainment?
We found some interesting insights into how much people across the U.S. spend on different types of entertainment. On average, Americans spend $3,138 annually on digital entertainment and $3,292 on in-person entertainment. Those close figures also lend themselves to some interesting regional trends, as 25 states report higher spending on in-person entertainment, while 19 states spend more digitally.
States that spend the most on digital entertainment:
- New Hampshire – $4,592
- Mississippi – $4,097
- Colorado – $3,763
- Texas – $3,731
- Ohio – $3,717
These states prioritize spending on entertainment options like streaming services, television, video games, and news media, to name a few.
States that spend the most on in-person entertainment:
- Nevada – $5,294
- Tennessee – $4,553
- Delaware – $4,440
- Arizona – $4,061
- Rhode Island – $4,040
Residents in these states favor social outings, recreational activities, and live shows. Nevada and Tennessee’s high spending is expected, given their vibrant scenes for live music and events.
A Closer Look at America’s Itemized Entertainment Bill
Now that we’ve covered regional shifts regarding entertainment spending, let’s zoom out a bit and get some insight into what the average American’s spending habits look like.
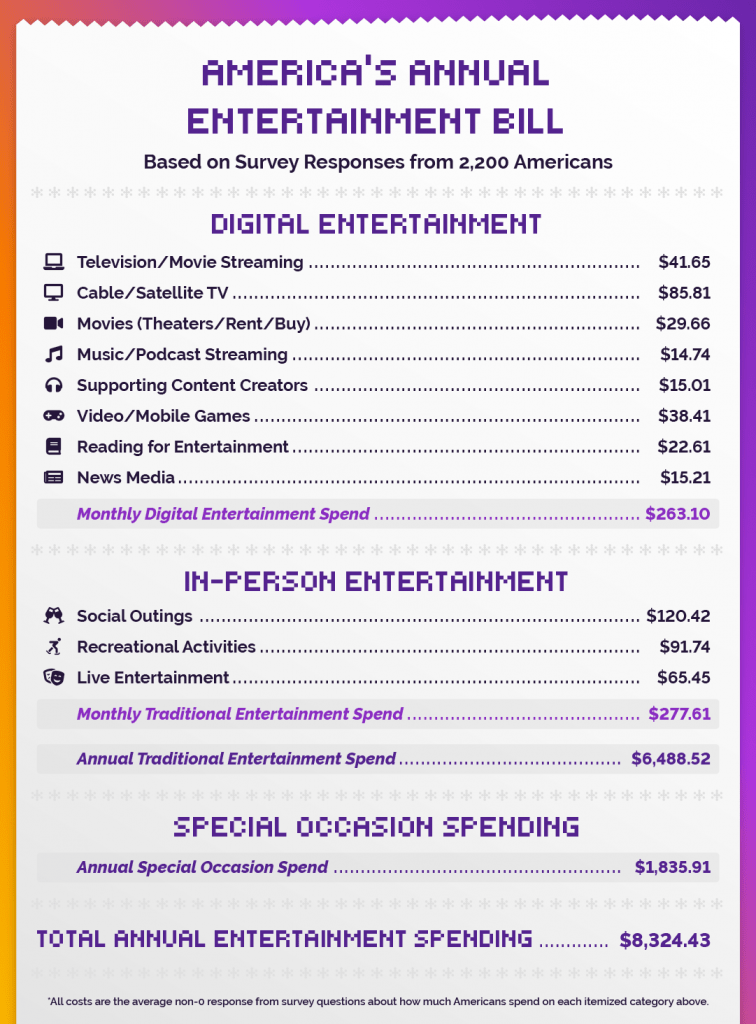
The average American spends about $263 monthly on digital entertainment. In comparison, they allocate roughly $120 per month for social outings, $92 for recreational activities, and $65 for live entertainment. On top of that, their average spend is an estimated $1,836 annually on special occasions, which includes things like big travel plans and events.
With so many options available, people will have to become more discerning with how they spend their time and money. Our survey respondents said they find the most value in:
- TV/movie streaming (71%)
- Music (44%)
- E-books/reading for entertainment (31%)
- Video games (29%)
When it comes to entertainment spending at RSS.com, we’re particularly interested in spending related to content creators. More specifically, the idea of value for value, where consumers can tip content creators (like podcasters) as a way of saying thanks for the value they get from the content.
We asked respondents how likely they would be to tip content creators on top of what they’re already paying (if anything).
- Over one-third of Americans (37%) have given money to support content creators such as podcasters, streamers, and YouTubers.
- 28% of Americans would be ‘likely’ or ‘very likely’ to give money to creators whose content they consume regularly.
We also looked at our regional data to see which states spend the most on supporting content creators directly (in terms of donations, tips, subscriptions, etc.)
- Nevada – $34.50 monthly
- Hawaii – $33.71
- Maine – $32.63
- Colorado – $24.73
- Massachusetts – $23.83
Knowing that directly supporting creators is something people are doing more and more, we wanted to find out what the biggest motivations are. The top reasons Americans cited for wanting to support their favorite creators are:
- Wanting to help the creator do their work (20%)
- Believing in the value of the content (17%)
- Wanting to support independent creators (16%)
- Accessing exclusive perks/content (15%)
However, several factors can deter people from financially supporting the creators they tune into most often. The biggest barriers to supporting them are:
- Being unable to afford it (51%)
- Preferring free content (14%)
- Not seeing the need to give money for the content (14%)
- Feeling they support creators enough for free (12%)
As entertainment options get more fragmented, consumers are going to need to give some extra thought when deciding where their dollars go. People will spend where they find the most value, whether that be from streaming television shows, reading for entertainment, or even directly supporting their favorite content creators.
Closing Thoughts
Entertainment spending varies a great deal across the United States, reflecting the diverse preferences and priorities of its residents. While some people splurge on digital entertainment, others invest more in in-person experiences. Regardless of how people spend their time, it’s clear that people value and find joy in the different forms of content that are popping up every day.
At RSS.com, we know the value content creators bring to the ever-changing media landscape and how important it is to support them, as highlighted by the significant number of Americans willing to contribute financially to their favorite creators. This support is crucial for creators who rely on it to produce the quality content their audiences love.
As a podcast-hosting platform, RSS.com is dedicated to helping podcasters reach and grow their audiences. By providing the tools and resources needed to share their passion, we enable creators to continue delivering the entertainment that listeners value and enjoy. Whether you’re a seasoned podcaster or just starting a new podcast, we’re here to support your journey every step of the way.
Methodology
To determine how much the average American spends on entertainment, we surveyed over 2,200 Americans from 44 states and asked them to estimate their monthly spending on different digital and in-person entertainment options, and their annual spending on special occasion entertainment events (like trips and more planned out events).
Based on responses, we were able to get an average estimated annual spend on digital in-person entertainment in every state and see which states spend more on which form of entertainment, as well as the total estimated annual spend.
We asked other entertainment-related questions to get some additional insights into how Americans view entertainment (and spending) today.
Cost averages are derived from the non-0 average of survey responses from every state to get an estimate for each itemized form of entertainment we asked about.