
Podcast analytics can be intimidating if you don’t fully understand the meaning behind the numbers.
However, grasping these insights is key to growing your listener base and attracting potential sponsors. Having a solid understanding of your analytics can help you leverage these metrics to enhance your podcast strategy.
As an IAB Tech Lab-certified company, RSS.com is committed to providing podcasters with accurate and reliable analytics. Our data meets the highest industry standards, empowering podcasters to make informed decisions about audience insights, sponsorships, and content strategies with confidence.
In this post, I’ll walk you through the various metrics available in your RSS.com analytics dashboard and explain how they can help you better understand your audience and grow your podcast.
Let’s dive into the world of podcast analytics!
How Is the Data Compiled?
To understand the numbers, it’s crucial to know how the data is collected.
When you set up your podcast and obtain an RSS feed address, podcast directories like Spotify and Apple Podcasts use this address to access and distribute your episodes.
For example, when someone plays an episode on Spotify, Spotify contacts RSS.com for the data, which is then compiled into your analytics tab.
Accuracy and Security
In order for your analytics to be actionable, the numbers need to be accurate.
As an IAB certified company, we ensure that all of your analytics adhere to rigorous industry standards.
Advanced Bot and Spam Filtering
RSS.com uses sophisticated filtering systems to ensure your analytics reflect genuine listener engagement. Our technology automatically identifies and excludes:
- Bot traffic from automated systems
- Spam downloads from non-genuine sources
- Duplicate requests from the same IP
- Partial downloads that don’t represent real listening intent
- Other artificial traffic patterns
This means every download, play, and listener metric you see represents a real person who chose to engage with your content.
Unlike some platforms that may inflate numbers with questionable traffic, RSS.com gives you clean, actionable data you can trust when making content decisions or presenting to potential sponsors.
Key Metrics Available in Your Podcast Analytics
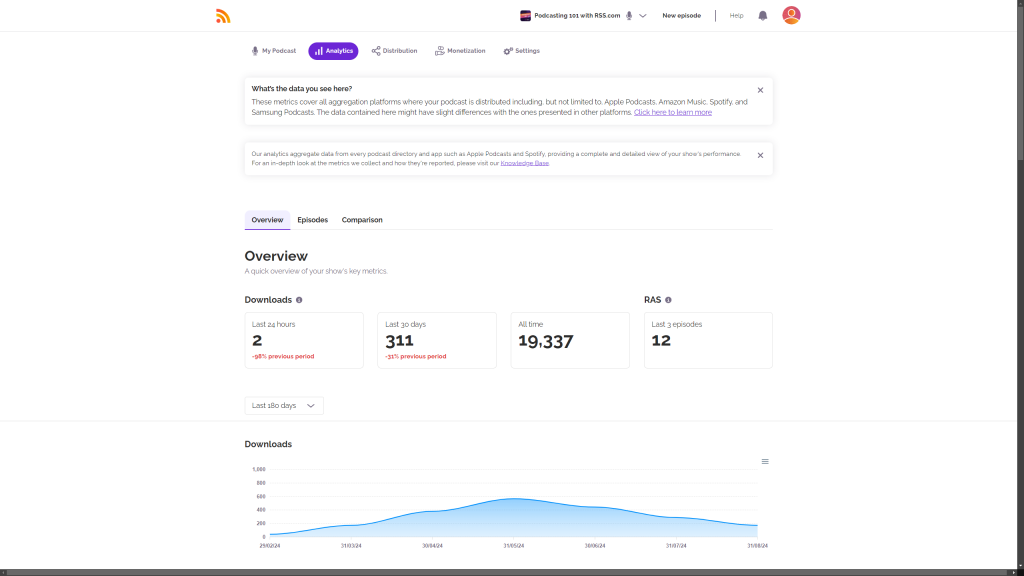
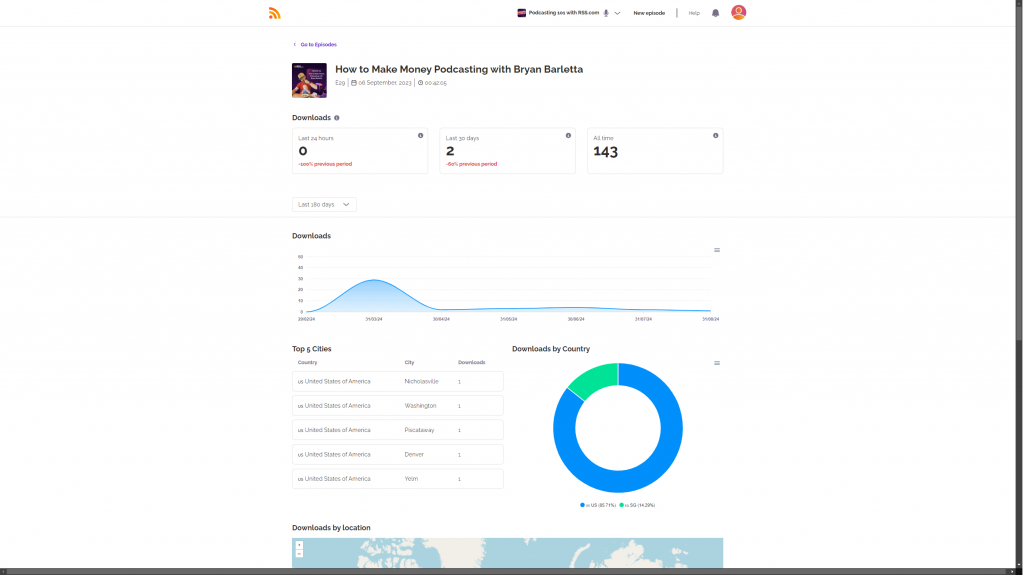
Downloads and Listeners — What’s the Difference?
Downloads show how many times an episode has been downloaded. Listeners represent individual people who listened to one or more episodes of your show. These two numbers won’t always match. If someone downloads an episode on multiple devices, or listens at a faster playback speed, the numbers can diverge.
Neither figure is wrong. They measure different things. When tracking your show’s growth over time, both are useful. When presenting numbers to a potential sponsor, it’s worth knowing which metric you’re referencing and being consistent about it.
You can view download data over different timeframes – last 7 days, 14 days, 30 days, 90 days, or 180 days.
Note: If you have the Free Local and Niche Plan, you will only be able to see 30 days worth of analytics. All in One Podcasting plans are limited to 180 days, and Podcast Networks plans can access unlimited “all time” data.
All times and dates are in UTC and are refreshed every 24 hours.
Rolling Average Subscribers (RAS)
The Rolling Average Subscribers (RAS) metric provides an estimate of your podcast’s follower count. This number is calculated by averaging the number of listeners in the first 24 hours over the last three episodes, helping you gauge your show’s consistent audience.
Visual Graphs
Your analytics dashboard includes visual graphs for average downloads and rolling average subscribers, which are updated hourly. These graphs provide a quick and easy way to track trends and growth over time.
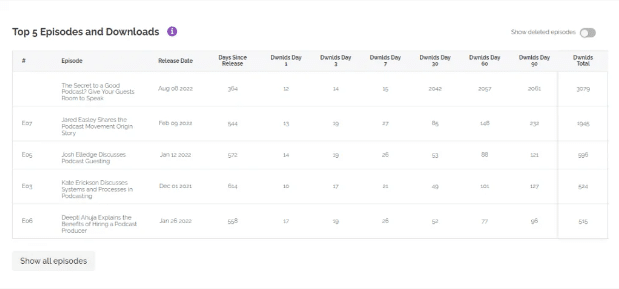
Detailed Episode Insights
In the “Episodes” tab, you can see which episodes are performing well based on download data. You can sort episodes by “Newest” or “Most Downloaded” to get a clearer picture of what resonates with your audience.
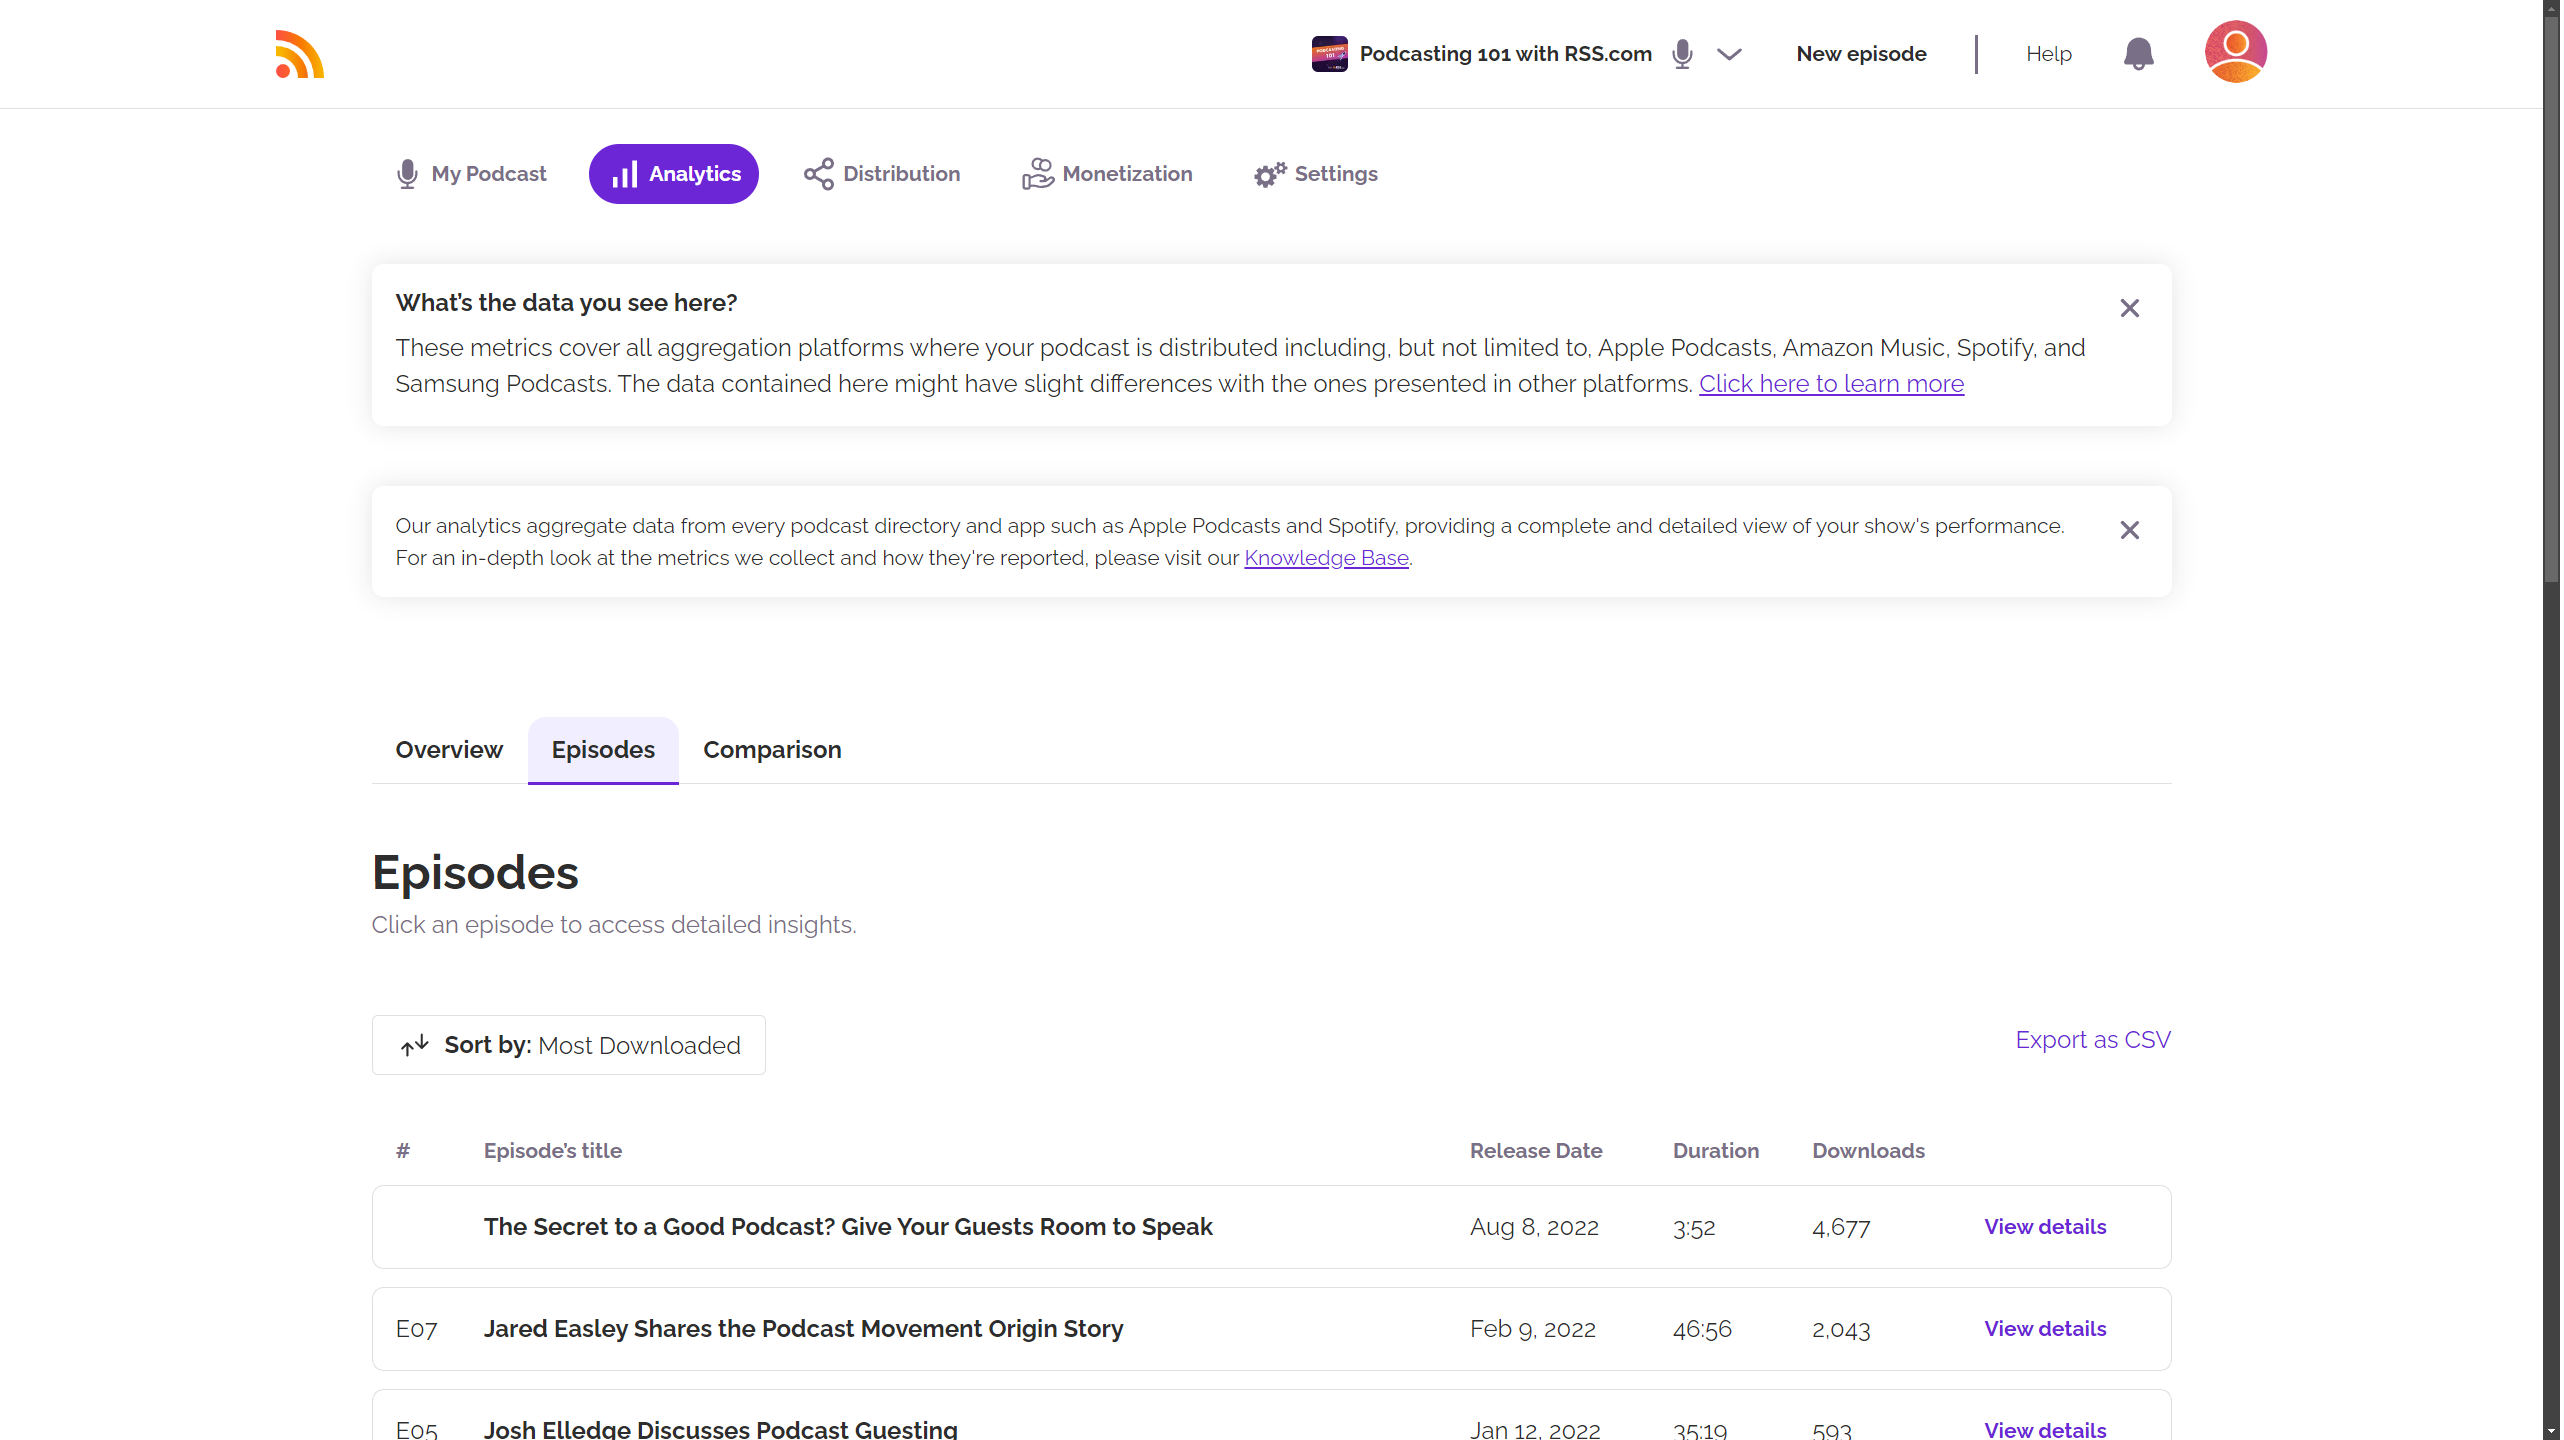
Want more detailed insights for individual episodes? Click each episode title to view them.
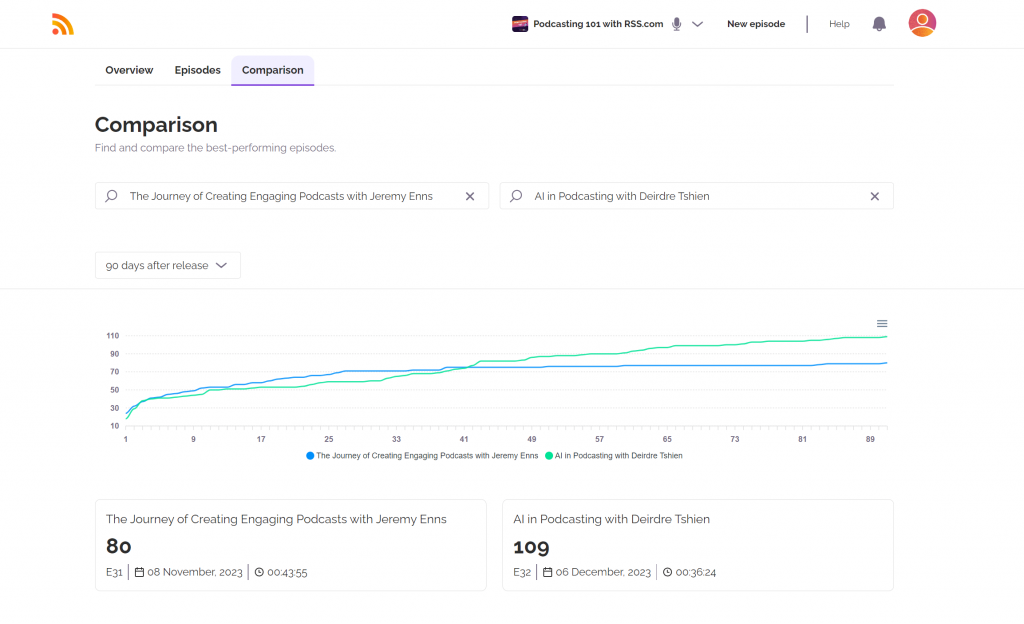
Episode Comparison
The “Comparison” tab lets you compare the performance of any two episodes, showing data for 7, 14, 30, 90, and 180 days after release.
This feature helps you understand which content drives more engagement and why.
Remember however, that only the All in One Podcasting plans and Podcast Networks plans can access more than 30 days worth of data.
- Free Local and Niche is capped at 30 days
- All in One is capped at 180 days, and
- Podcast Networks can view “all time” data
Apps, Directories & Browsers
This section breaks down where your podcast is being downloaded – whether on platforms like Samsung Podcasts, iTunes, Spotify, or Apple Podcasts so you know which apps are most popular with your listeners.
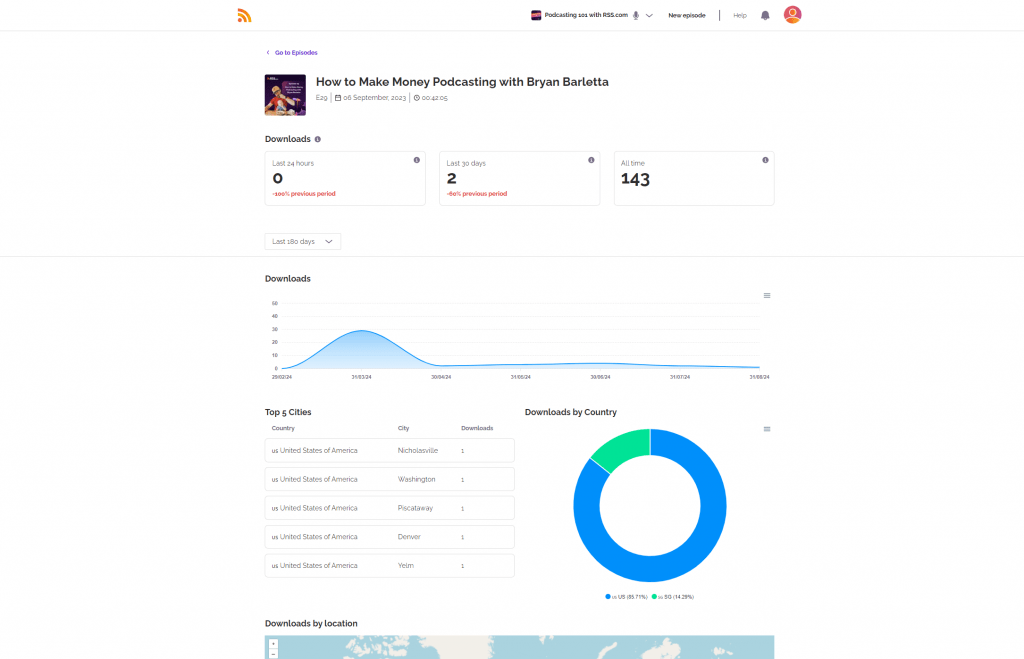
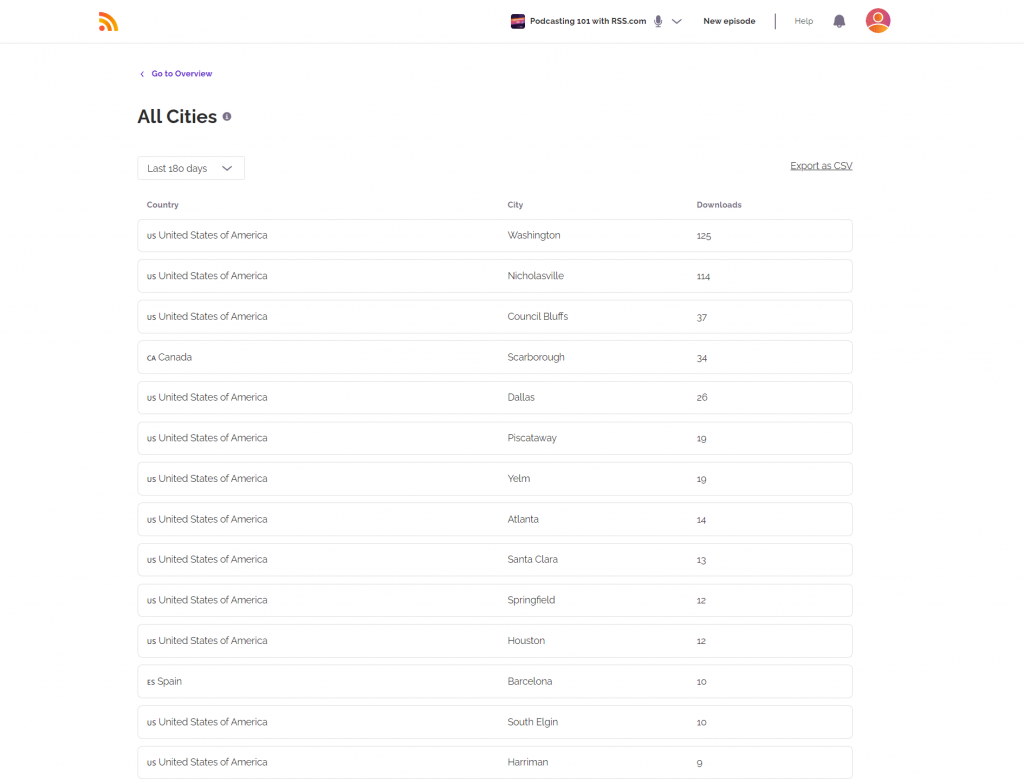
Top 5 Cities and Downloads by Country
Understand where your audience is listening from with insights into the top five cities and a breakdown by country. You can also view all cities and export this data as a CSV file for further analysis.
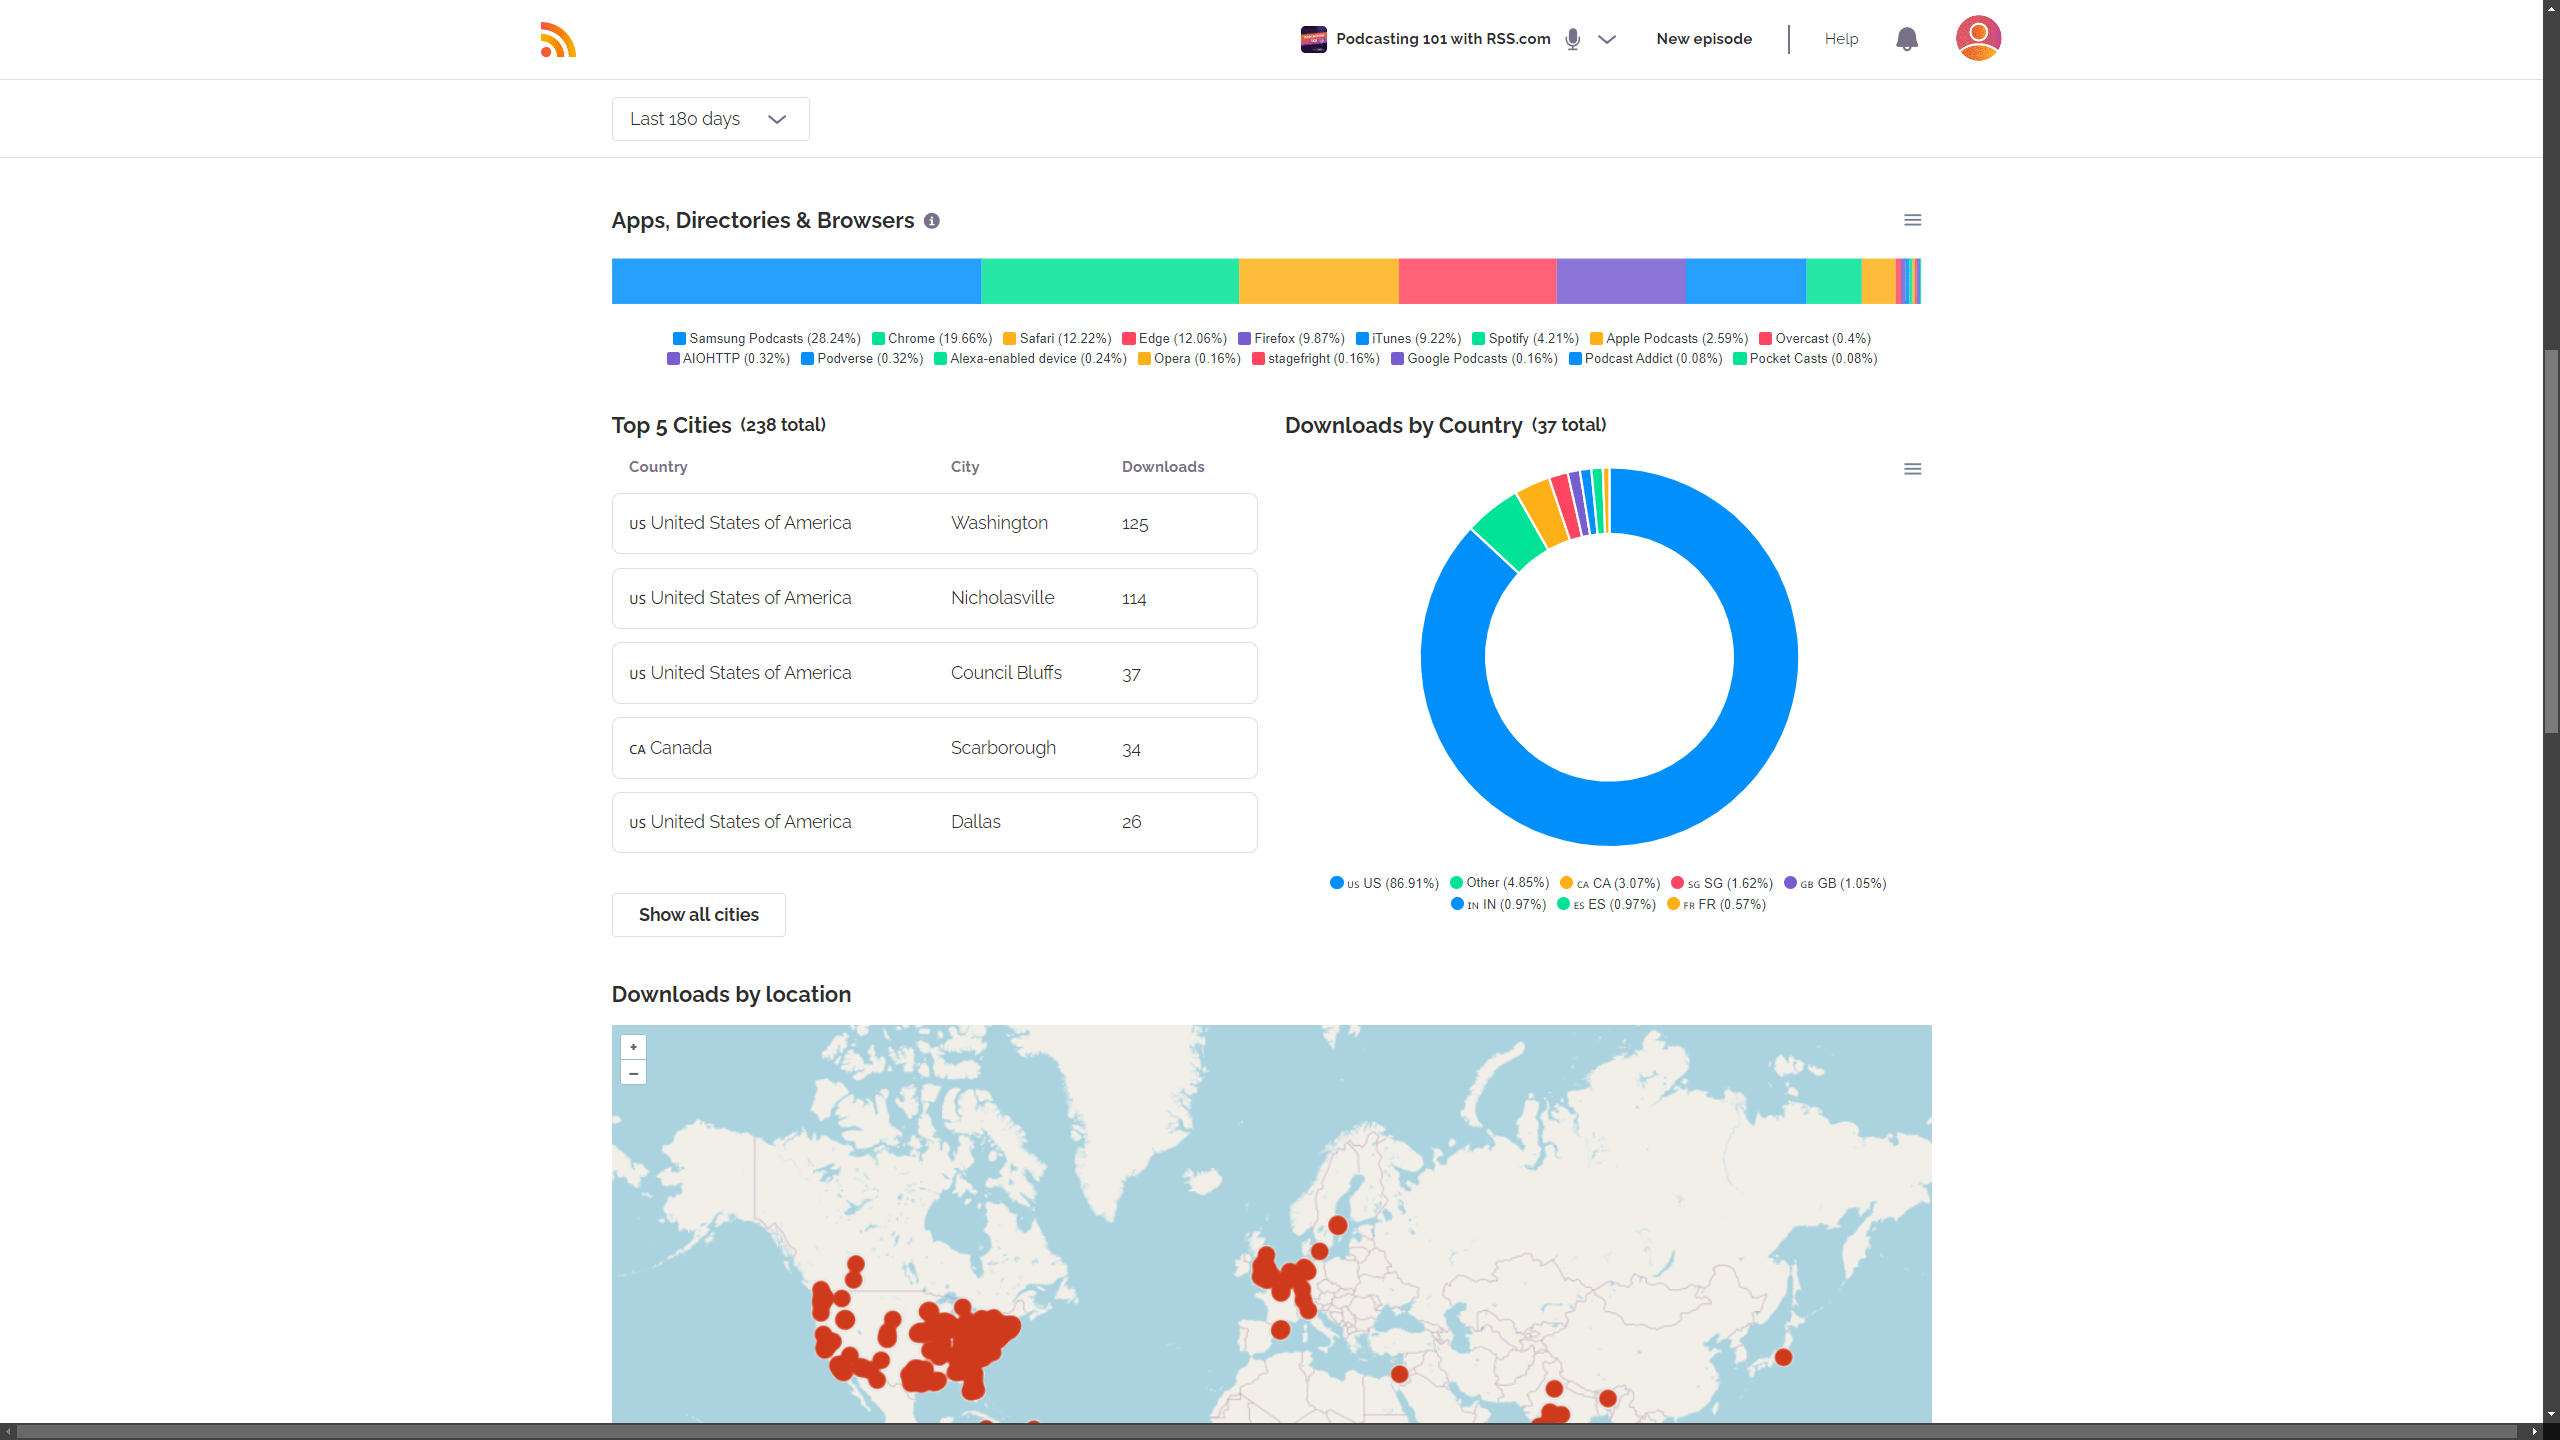
If you click on the “Show all cities” button underneath your top 5 cities, you can view all the cities that are tuning into your podcast.
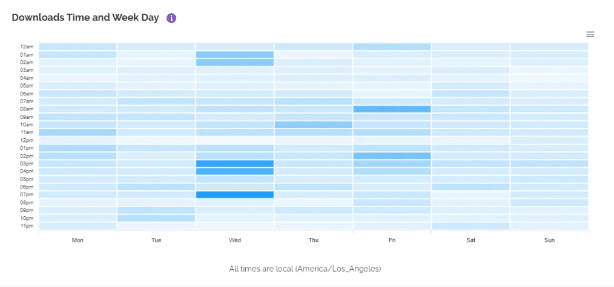
Listening Trends: Time of Day and Day of the Week
Discover when your audience is most active with insights on listening habits by time of day and day of the week, allowing you to optimize your release schedule.
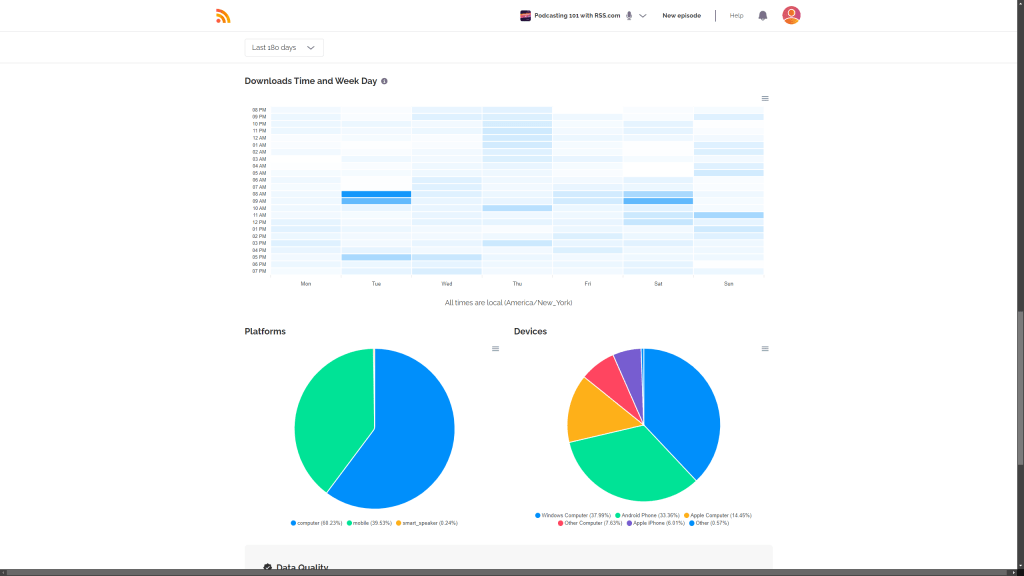
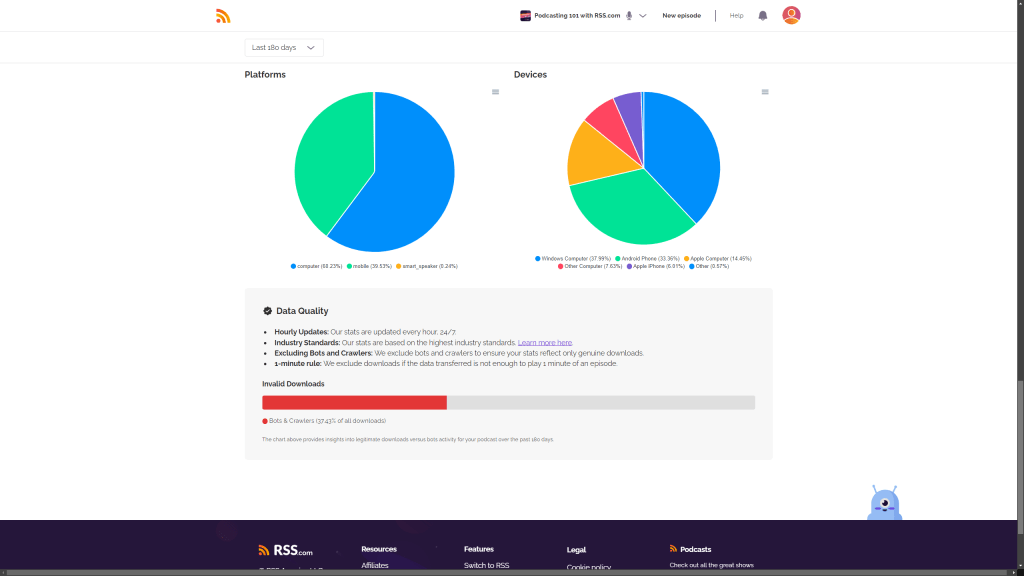
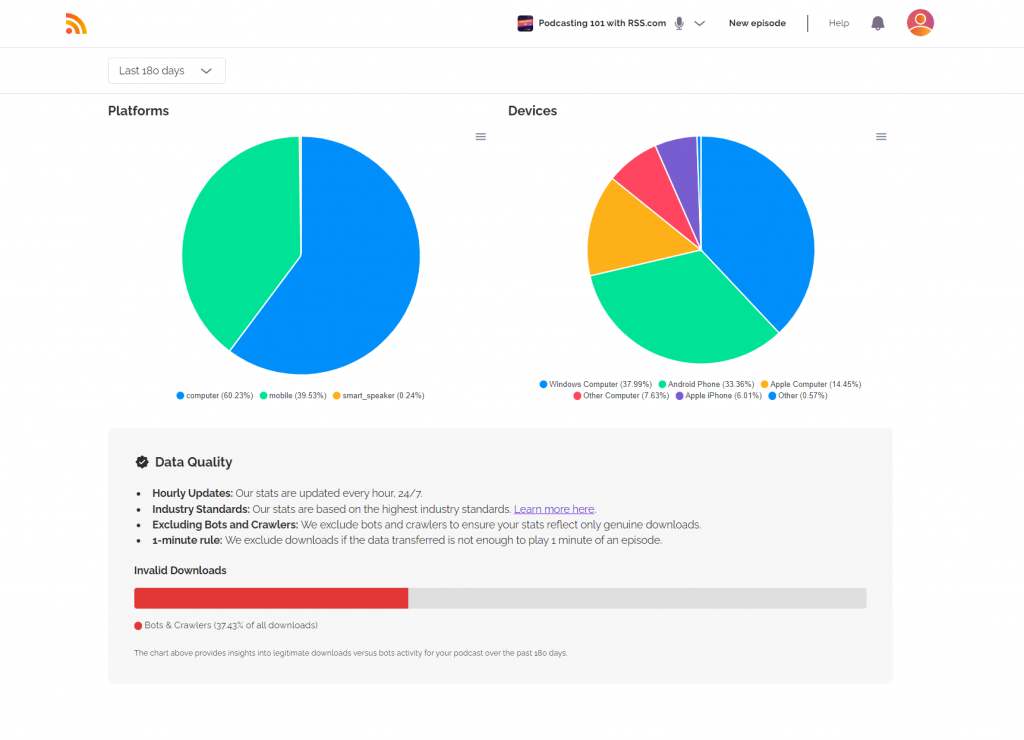
Devices and Platforms
Learn how your content is consumed by seeing which devices and platforms your listeners use, providing insights into where to focus your promotional efforts.
Geographic Heat Map
The geographic heat map visually displays the locations where your podcast is most popular, helping you identify key regions for targeted marketing.
Data Quality Assurance
Our analytics programming identifies and excludes invalid downloads caused by bots and crawlers, ensuring that only genuine downloads are counted. This focus on data quality provides you with actionable insights that reflect your true audience.
Interpreting the Data
It’s important to interpret your podcast analytics correctly.
Instead of focusing on daily numbers, analyze data over longer periods like weeks, months, or quarters. This broader view helps you better understand your show’s overall performance and direction, enabling you to make informed decisions about content and audience engagement strategies.
Understanding your podcast analytics is key to making informed decisions that enhance your content and audience engagement. Use these insights to grow your podcast and reach a wider audience.
For more information on RSS.com’s analytics and other features, visit our Analytics Knowledge Base here.
What to do when consumption rate is low
If your Apple Podcasts consumption rate shows a steep drop in the first five minutes, the most common fix is shortening your intro. Long intros, lengthy sponsor reads before the main content, or slow openings push listeners away before you’ve had a chance to deliver value. Try trimming your intro to 30 seconds or less, then check your consumption rate over the next few episodes to see if it improves. Small adjustments can make a meaningful difference over time.
Go Beyond RSS.com — Claim Your Show on Apple and Spotify for Deeper Insights
Your RSS.com analytics give you a holistic picture of how your show is performing across all platforms and directories. But Apple Podcasts and Spotify each surface first-party data that no hosting platform can provide, and it’s worth taking the time to access both.
Apple Podcasts Connect: Consumption Rate
The most valuable metric Apple Podcasts Connect offers is consumption rate. This is how much of each episode your listeners actually hear. This data is tracked at the episode level and shown as a percentage of the episode completed.
A consumption rate that drops sharply in the first few minutes tells you something specific: your intro may be too long, your audio levels may be inconsistent, or the episode’s opening isn’t holding attention. A strong consumption rate (e.g., say, 60% or higher on a 45-minute episode) suggests your content is landing well with the listeners who find it.
This is one of the most actionable signals available to podcasters. If you’re not checking it, you’re missing a clear window into what’s working and what isn’t.
To access Apple Podcasts analytics, you need to claim your show in Apple Podcasts Connect. From your RSS.com dashboard, go to the Distribution tab, enable Apple Podcasts, and once your show is live, copy your Apple Podcasts URL to use during the claiming process.
Spotify: The Discovery Funnel
Spotify’s analytics include a discovery funnel that shows how many listeners saw your show in search or recommendations, how many clicked, and how many actually listened to an episode.
This tells you something your download numbers can’t: whether your show’s packaging (e.g. your title, cover art, and description) is doing its job.
If your show is getting impressions but low click-throughs, that’s a signal about presentation, not content. If click-throughs are solid but listening drops off quickly, the content itself may need attention. Spotify also supports comments and polls, giving you a direct way to interact with listeners on the platform.
Using All Three Together
RSS.com, Apple Podcasts, and Spotify each show you a different piece of the picture. RSS.com gives you the aggregate view across all directories. Apple Podcasts shows you how deeply listeners engage with your episodes. Spotify shows you how well your show is being discovered.
Keep in mind that your audience may behave differently depending on where they listen. Younger listeners skew toward Spotify, while longtime podcast listeners tend to be on Apple Podcasts. Understanding the breakdown helps you make smarter decisions about where to focus your promotional efforts and how to tailor your content for each platform.
How to Read Your Podcast Analytics (RSS.com, Apple & Spotify Explained)
Watch our March 2026 live training How to Read Your Podcast Analytics (RSS.com, Apple & Spotify Explained):