
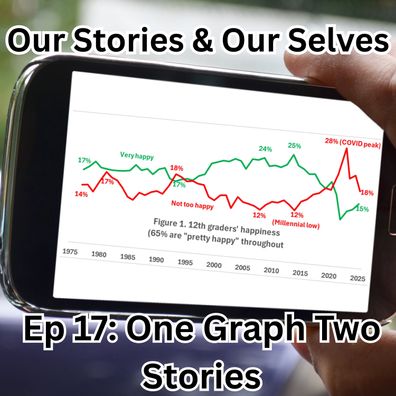
One Graph Two Stories: how statistics can be misused to tell stories, and what the numbers actually tell us about young peoples mental health
Notas del episodio
Statistics can be used, and abused to tell all sorts of stories. This episode I dig into some of the ways that statistics can be misrepresented and how the same graph can be used to tell different stories, depending on how someone looks at it. This is especially the case when it comes to young people, mental health and social media use.
Source list available at https://www.ourstoriesandourselves.com/
Get in touch on OurStoriesAndOurSelves@gmail.com or @ourstories.bsky.social
Music from https://pixabay.com/users/good_b_music-22836301/
Support the show by buying a book from: https://uk.bookshop.org/shop/ourstoriesandourselves
Or back the patreon patreon.com/OurStoriesandOurSelves
Cover image created from https://pixabay.com/users/creapark-6555204 and https://mikemales.substack.com/p/todays-teenage-mental-health-crisis
The article and graph which prompted me to write this episode:
Males, M. (2025, November 25). Today’s “teenage mental health crisis” and social media panic are founded in nostalgic myths [Substack newsletter]. Mike’s Substack. https://mikemales.substack.com/p/todays-teenage-mental-health-crisis